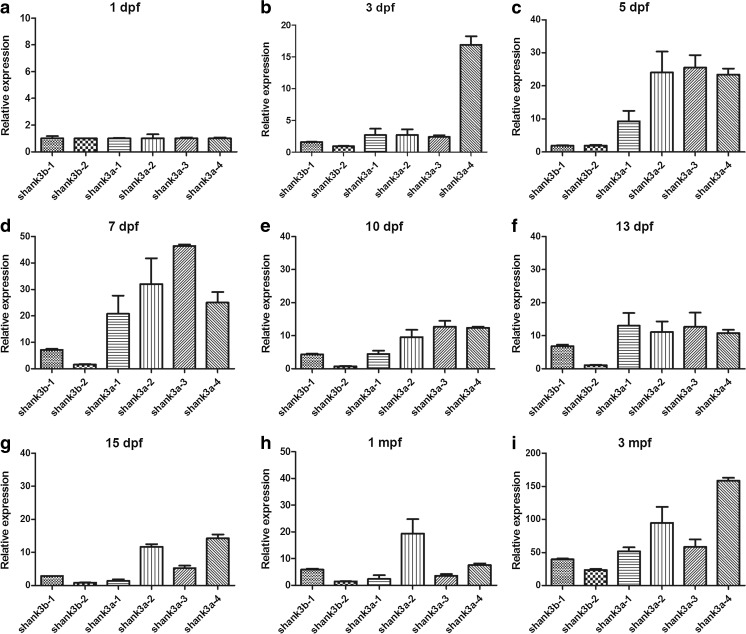
Fig. 5.
Isoform-specific pattern during the same period. a–i Comparisons of the expression patterns of six different shank3 isoforms in the zebrafish brain at the same stage are shown. The crossing point (CP) values of each isoform were normalized to that of a housekeeping gene, β-actin. The error bars denote the standard deviations from three RNA sample replicates for each developmental time point. All data are shown as the means ± SEM

