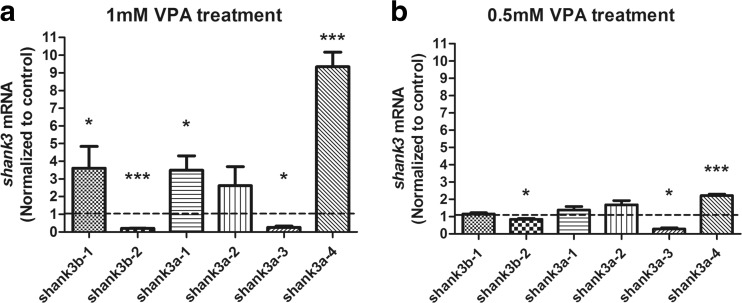
Fig. 6.
Isoform-specific expression of zebrafish shank3 induced by VPA compared with the control. a, b q-PCR analysis of zebrafish shank3 transcripts at 48 hpf after treatment with 1 or 0.5 mM VPA for 24 h. All data are shown as the means ± SEM. The statistical significance values, such as *P < 0.1, **P < 0.01, and ***P < 0.005, of differences compared with the control group were determined through two-tailed t test (n = 15 in each group)

