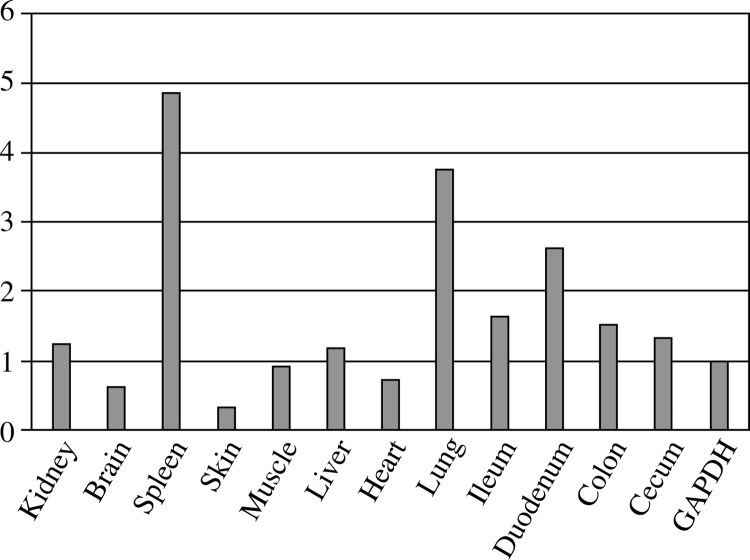
Fig. 4.
rTLR-1 expression throughout the tissue cells (spleen, skin, duodenum, lung, ileum, colon, kidney, liver, cecum, heart and brain). TLR expression counts were normalized to GAPDH using the formula 2− (TLR−GAPDH). All values represent mean ± standard error of the mean of triplicate from quantitative real-time PCR assays

