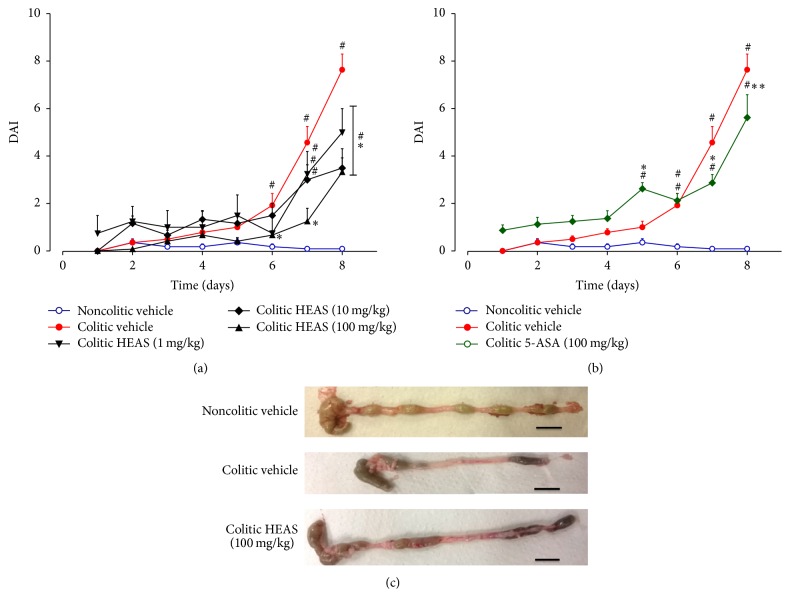
Figure 3.
Effects of HEAS (1–100 mg/kg (a)) or 5-ASA (100 mg/kg (b)) on DAI values over the whole experimental period. (c) Macroscopic appearance of colon from mice treated with vehicle or HEAS (100 mg/kg). Data are expressed as mean ± SEM (n = 10). Statistical comparison was performed using two-way ANOVA followed by Bonferroni's test. # P < 0.01 versus noncolitic group. ∗∗ P < 0.01 and ∗ P < 0.01 and versus control-colitic group.

