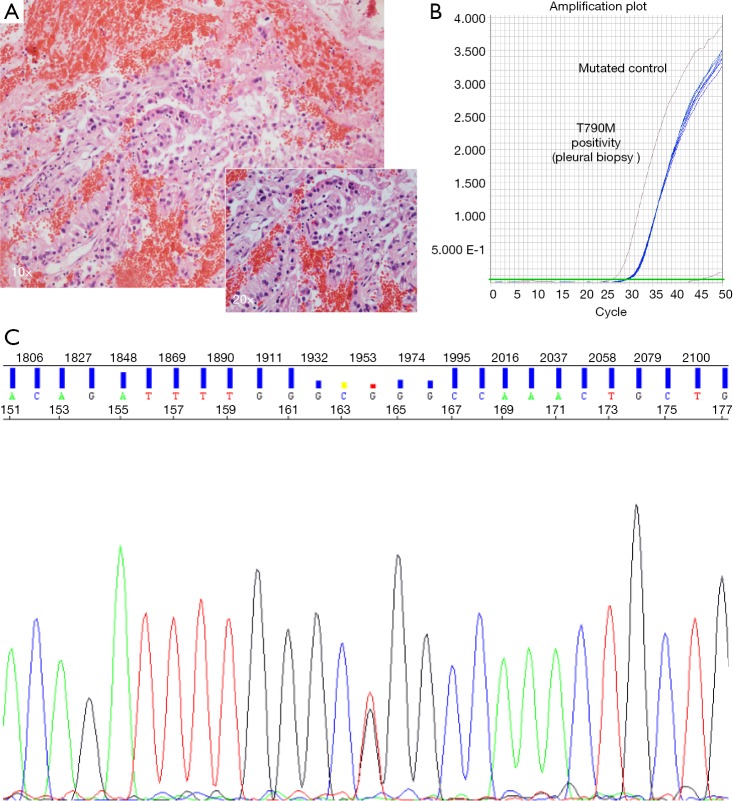
Figure 1.
Histological and molecular analysis of pleural biopsy at progression disease. (A) H&E stain. Below and to the right (magnification, ×20); (B) T790M positivity: amplification curve using a PNA-mediated 5’ nuclease real time Taqman PCR, blue amplification line corresponds to the patient; (C) L858R mutation confirmed by Sanger sequencing. PNA, peptide-nucleic acid.

