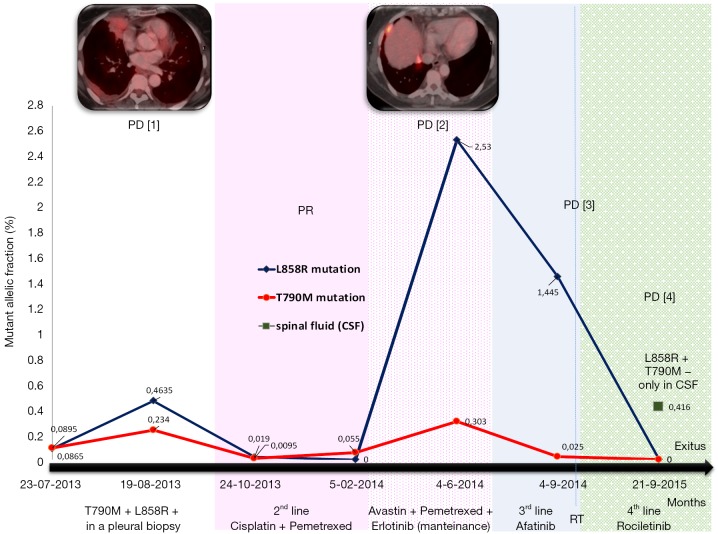
Figure 2.
Summary of evolution: correlation of clinical data and EGFR mutations status [L858R mutation, in blue; T790M mutation, in red, spinal fluid (CSF) in green] in a serial ctDNA analysis. PD [1]: pleural progression, PD [2]: pleural and lung progression, PD [3]: lung and brain progression, PD [4]: brain progression. Different lines of treatments were indicated with specific colors. PD, progression disease; PR, partial response; CSF, cerebrospinal fluid; EGFR, epidermal growth factor receptor; ctDNA, circulating tumor DNA.

