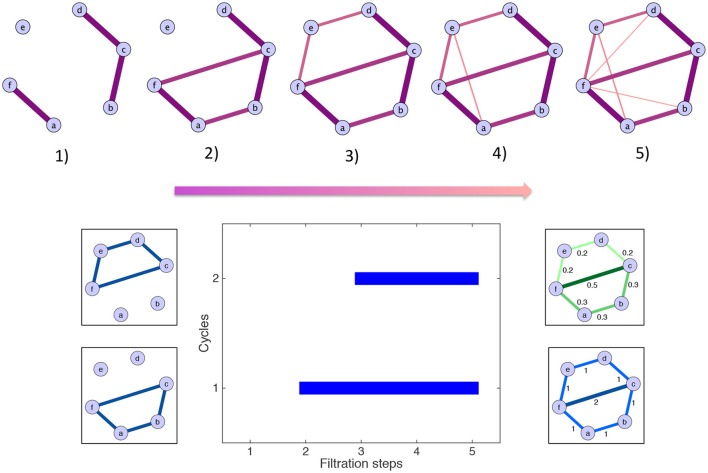
Figure 3.
Toy example illustrating the generation of the homological scaffolds. On top The filtration: edges are added in decreasing order of weight (thickness and color represent the weights) to arrive at the original network at step (5). Bottom middle The barcode encoding the persistence of the two cycles 〈abcf〉 and 〈cdef〉. Bottom right The persistence (green) and frequency (blue) scaffolds, summarizing the role of the edges in the cycles present during the filtration.

