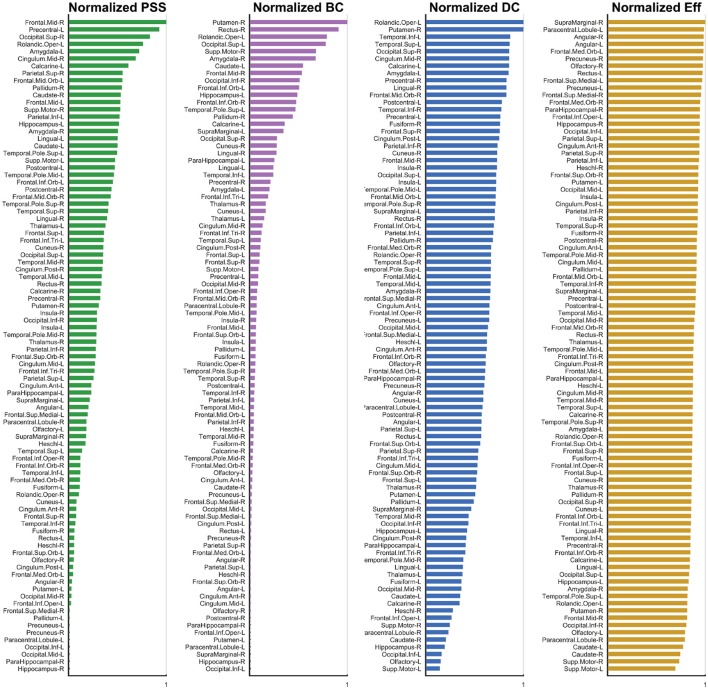
Figure 6.
Normalized Metric Values. The normalized nodal values are displayed for each graph measure under study. The values for PSS, BC, DC, and Eff are respectively depicted from left to right. While computation of the PSS does not require ad hoc thresholding, the BC, DC, and Eff metrics are threshold-dependent and nodal metric values have thus been integrated over the threshold range under study to generate a single value for each node. The analysis used is described in detail Section 3.2.

