
Figure 2.
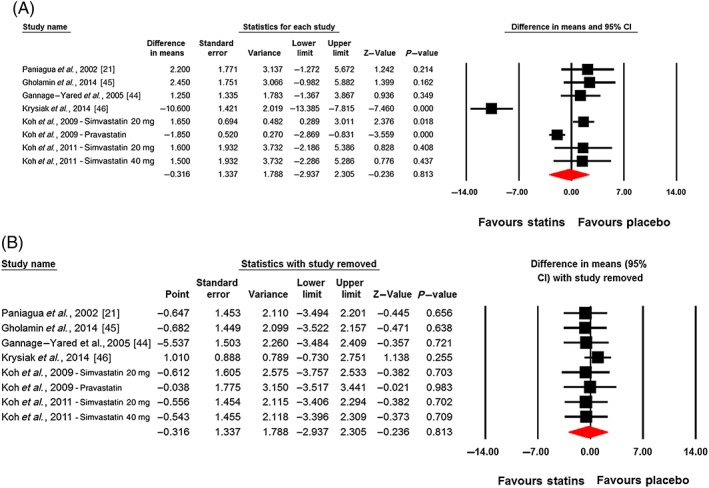
Plot A is the forest plot displaying weighted mean difference and 95% confidence intervals for the impact of statin therapy on plasma leptin concentrations. Plot B shows the results of leave‐one‐out sensitivity analysis (removing one study each time and repeating the analysis)