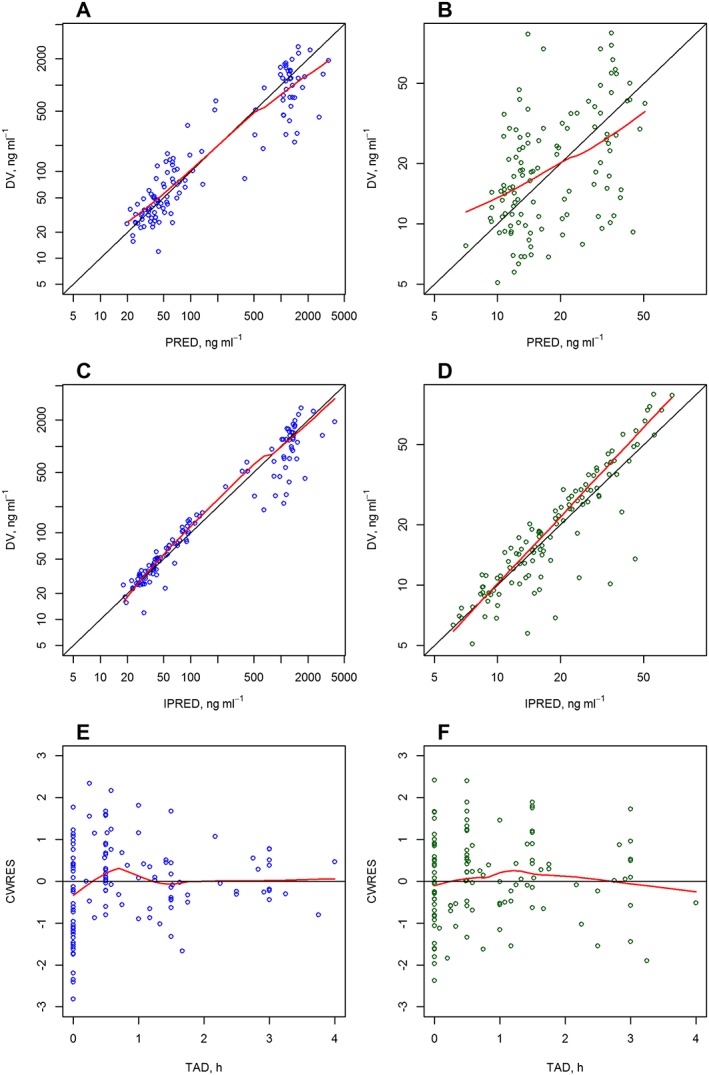
Figure 1.

Goodness‐of‐fit plots for the final population pharmacokinetic model for doxorubicin (A, C, D) and doxorubicinol (B, D, F). CWRES, conditional weighted residual; DV, dependent variable (drug plasma concentration); IPRED, individual prediction; PRED, population prediction; TAD, time after dose. Black solid line, reference line in the diagnostic; red solid line, observed trend line in the plots (locally‐weighted polynomial regression)
