
Figure 2.
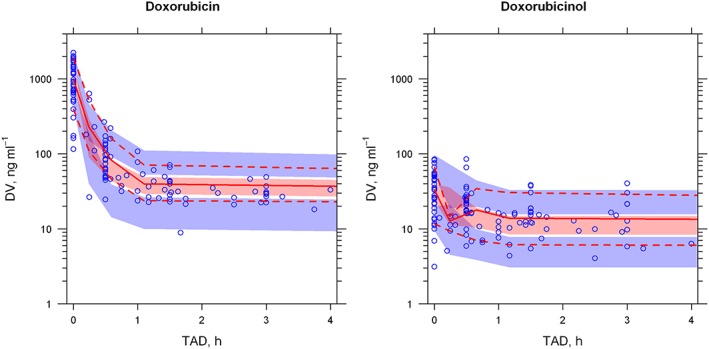
Prediction‐ and variability‐corrected visual predictive check (pcVPC) plot of the final population pharmacokinetic model. DV, dependent variable (drug plasma concentration); TAD: time after dose. The blue circles represent prediction‐ and variability‐corrected observations for doxorubicin (left) and doxorubicinol (right); the red solid line represents the 50th percentile of the prediction‐ and variability‐corrected observations; the red‐shaded area represents the 95% confidence interval (CI) for the 50th percentile of the simulated data; the red dashed line represents the 10th and 90th percentiles for the DOX observations; the blue‐shaded area represent the 95% CI for the 10th and 90th percentiles of the simulated data