
Figure 1.
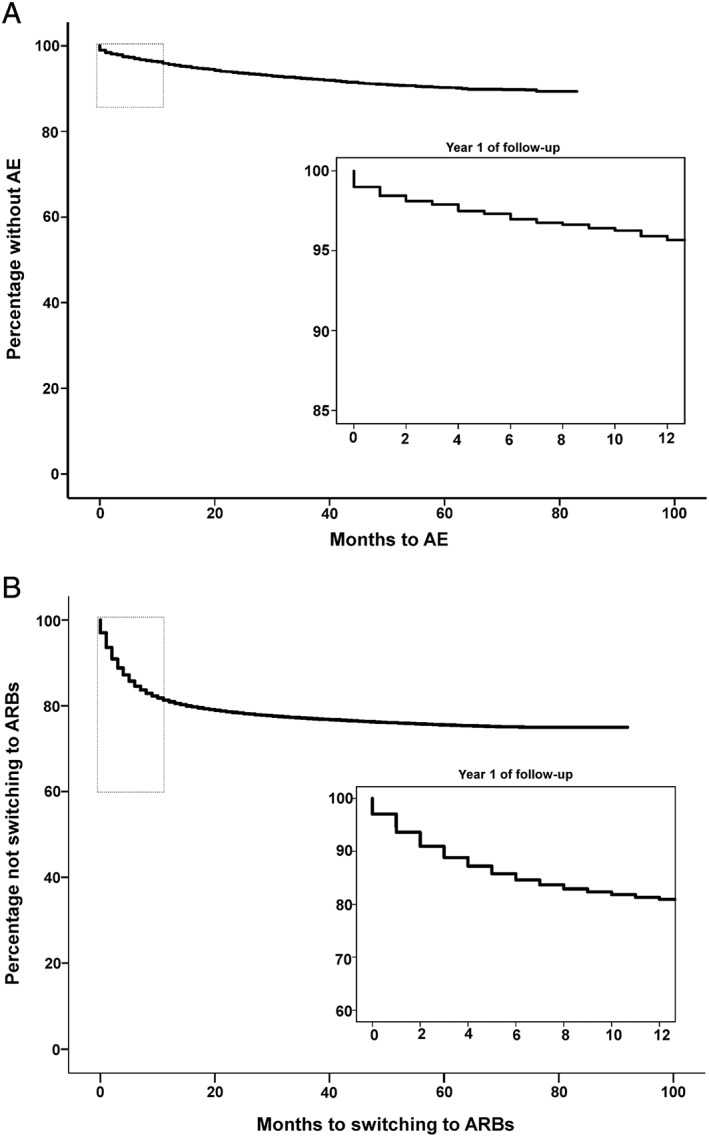
Time to the development of angiotensin‐converting enzyme inhibitor (ACEI) intolerance and angioedema during ACEI therapy. (A) Kaplan ‐Meier curves for time to the development of AE during ACEI therapy. Kaplan‐Meier curves were constructed for cases only. The top left rectangle indicates the area of Kaplan‐Meier curve depicted in the bottom right panel. The bottom right panel shows time to event during the first year of follow‐up. (B) Kaplan ‐Meier curves for time to switching to ARBs. Kaplan‐Meier curves were constructed for cases only. The top left rectangle indicates the area of Kaplan‐Meier curve depicted in the bottom right panel. The bottom right panel shows time to event within the first year of follow‐up. AE, angioedema; ARB, angiotensin II receptor blocker