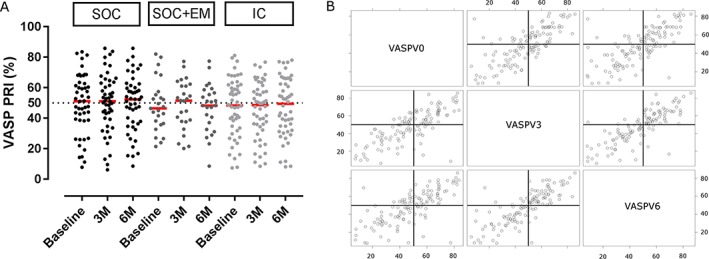
Figure 3.

Inter‐ and intraindividual VASP‐PRI variability (A) and correlation of VASP‐PRI results over time (B). The dotted line represents the 50% cutoff. Red lines are medians. IC = integrated care (light grey); SOC = standard of care (black); SOC + EM = SOC + electronic monitoring (dark grey); VASP‐PRI = vasodilator‐stimulated phosphoprotein phosphorylation–platelet reactivity index; M = months
