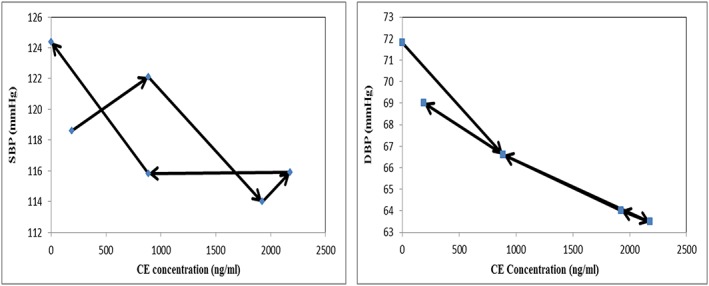
Figure 4.

Predicted concentration in effect compartment vs. mean blood pressure response plot after single dose of 160 mg valsartan was given. The concentrations were predicted with the chosen final model, an effect compartment delay and an I max model. SBP is shown on the left‐hand side and DBP is shown on the right‐hand side. Arrows indicate increasing time
