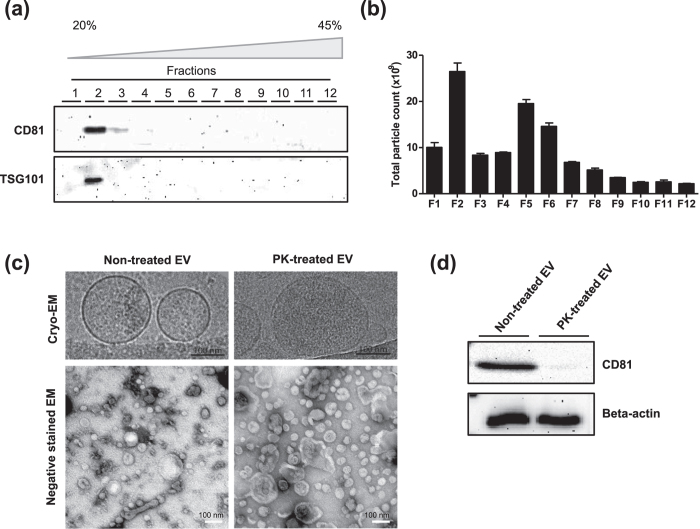
Figure 2. Characterization of EVs and PK-treated EVs.
(a) Western blot analysis with EV markers, CD81 and TSG101, in 12 fractions from OptiPrep density gradient. (b) The particle number in each OptiPrep fraction was analyzed by nanoparticle tracking analysis. (c) Cryo-EM images of non-treated and PK-treated EVs. (d) Western blot analysis of non-treated and PK-treated EVs with CD81 and beta-actin.

