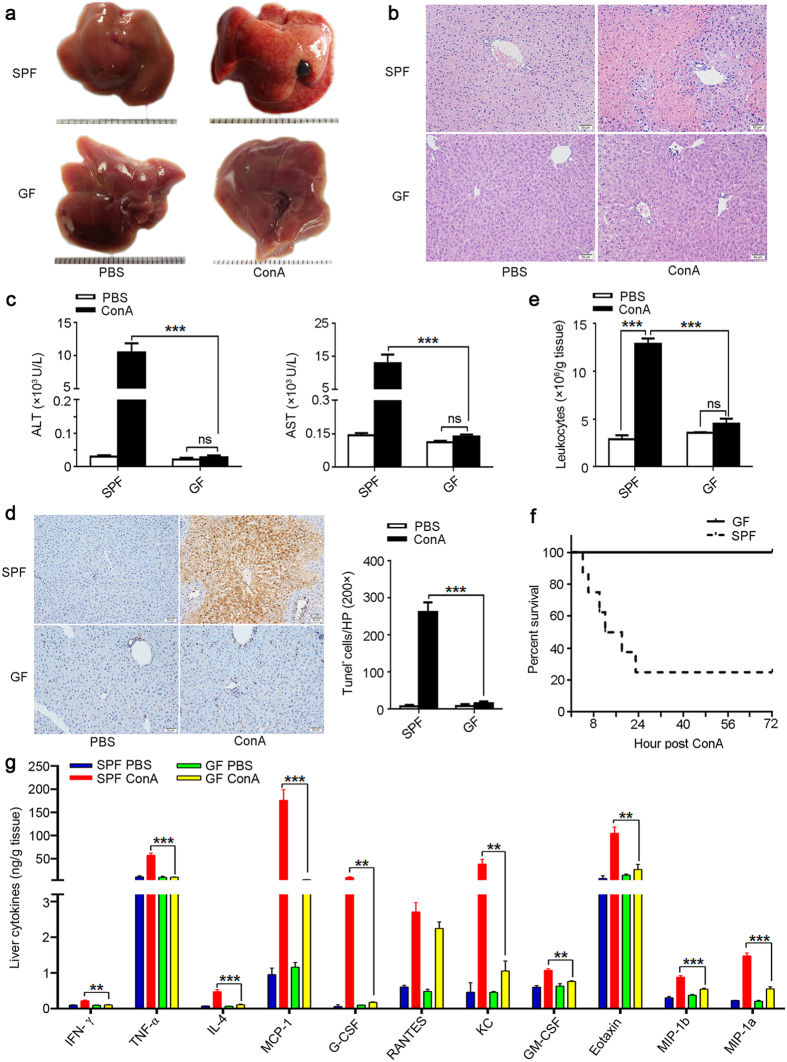
Figure 1. GF mice fail to develop ConA-induced liver injury.
(a–e,g) ConA or PBS was injected into SPF or GF BALB/c mice, after 24 hr mice were sacrificed. (a) Gross appearances of livers. Scale bar represents 0.1 cm. (b) Representative histological appearance (H&E staining) of livers. Original magnification, 200×, scale bar represents 50 μm. (c) Serum ALT and AST levels. (d) TUNEL assay of liver sections. Original magnification, 200×, scale bar represents 50 μm. The TUNEL-positive cells per field are shown in the right panel (calculated by Image J software). (e) The number of intrahepatic infiltrating leukocytes. (f) Survival analysis of mice after injecting a lethal dose of ConA (30 mg/kg), survival was monitored for 72 hr and log-rank test was used to assess for differences in survival. (g) Cytokine profile of the liver was analyzed by the Luminex enzyme immunoassay system. The data represent means ± SEM (n = 8, two independent experiments). **P < 0.01, ***P < 0.001, ns represents not significant, (c–d,g) One-way ANOVA.

