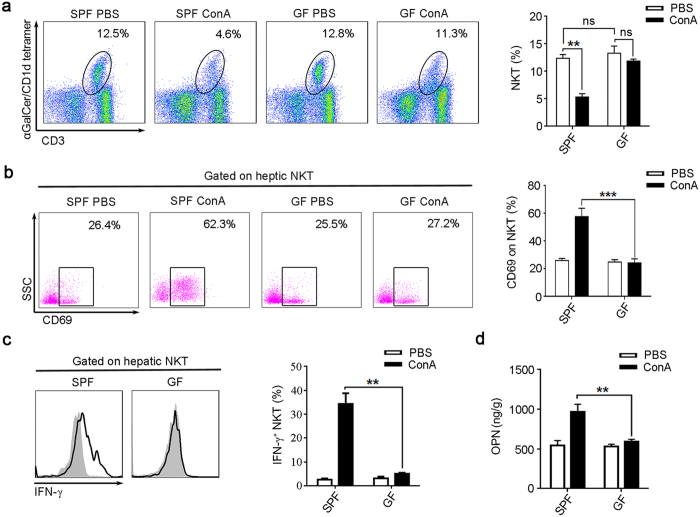
Figure 2. ConA is unable to activate NKT cells from GF mice.
BALB/c mice were sacrificed 24 hr after ConA or PBS injection. (a–c) Intrahepatic leukocyte was analyzed by flow cytometry. (a) The percentages of NKT cells (CD19−CD3+αGalCer/CD1d tetramer+) were determined, the representative scatterplot (left panel) and summative histogram (right panel) are shown. (b) Measurements of CD69 expression on hepatic NKT cells. (c) The intracellular IFN-γ levels in hepatic NKT cells, the filled flow cytometric histograms represent PBS-treated mice, and the open histograms represent ConA-treated mice. (d) OPN levels in the liver tissue, analyzed by Elisa. Two independent experiments with similar results were performed. The data represent means ± SEM (n = 8, two independent experiments). **P < 0.01, ***P < 0.001, ns represents not significant, One-way ANOVA.

