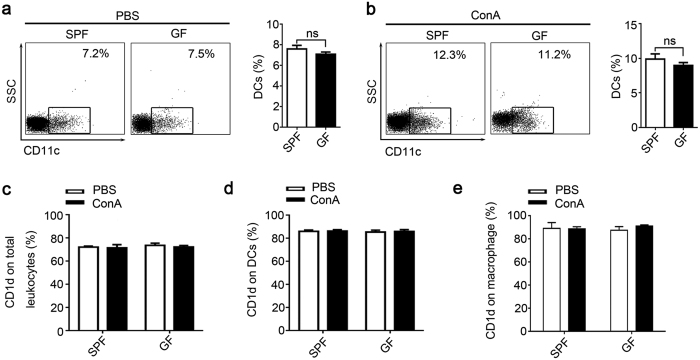
Figure 4. Analyze of APCs phenotypes and CD1d expression.
Liver infiltrating leukocytes were prepared from SPF and GF BALB/c mice 24 hr after ConA or PBS injection. The percentages of CD11c+ DCs after (a) PBS or (b) ConA treatment were determined by flow cytometry. The CD1d expression of (c) total intrahepatic leukocytes, (d) DCs (CD11c+) and (e) macrophage cells. The data represent means ± SEM (n = 8, two independent experiments), ns represents not significant, (a,b) Mann-Whitney U test, (c–e) One-way ANOVA.

