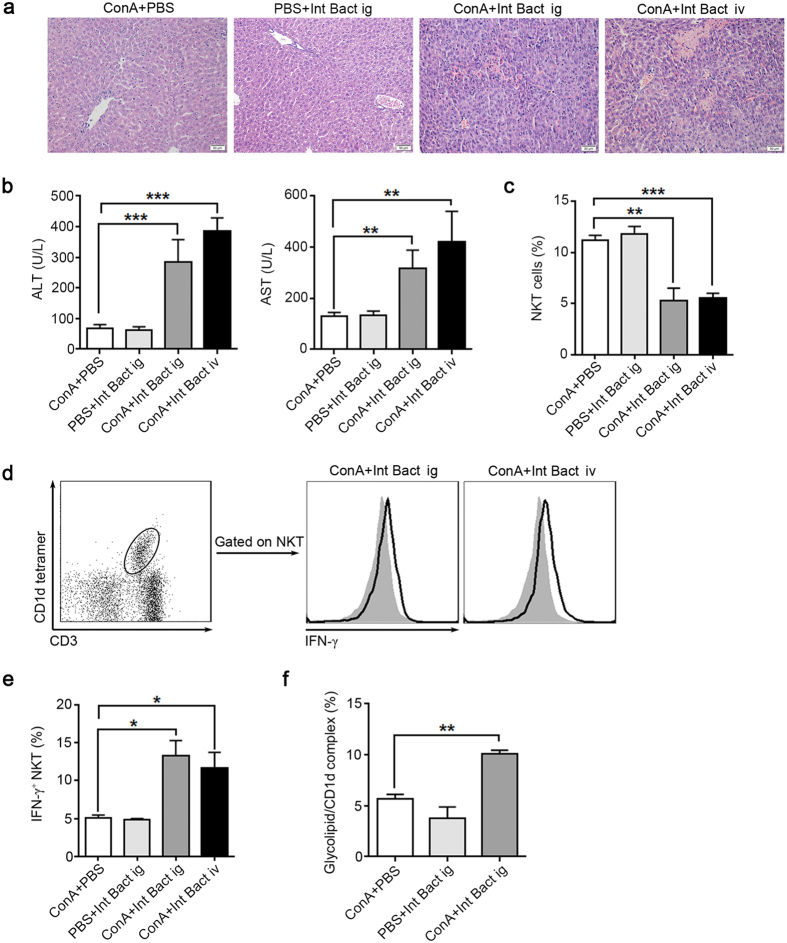
Figure 6. ConA-induced liver injury is restored in bacteria-treated GF mice.
Except for the ‘ConA+PBS’ group, other groups were pretreated with a mixture of killed intestinal bacteria (Int Bact) prior to ConA injection by intragastric gavage (ig) or intravenous injection (iv), 8 GF BALB/c mice per group. “ConA + PBS” group received 8 day PBS orally administration followed by ConA injection, “PBS + Int Bact ig” group received 8 day Int Bact orally administration followed by PBS injection. “ConA + Int Bact ig” group received 8 day Int Bact orally administration followed by ConA injection. “ConA + Int Bact iv” group received an Int Bact injection followed by ConA injection (see details in the supplementary methods). Int Bact was consisted of E. coli, E. faecalis, Lactobacillus, Salmonella enteritidis and Group A Streptococcus. (a) H&E staining of livers. Original magnification, 200×, scale bars represents 50 μm. (b) Serum ALT and AST levels. (c) Percentages of hepatic NKT cells in intrahepatic leukocytes. (d) Intracellular IFN-γ levels in hepatic NKT cells, filled flow cytometric histograms represent GF mice with PBS treatment before ConA injection, and open histograms represent GF mice pretreated with Int Bact before ConA injection. (e) The percentages of IFN-γ+ NKT cells in total hepatic NKT cells. (f) The level of glycolipid/CD1d complex of total intrahepatic leukocytes, detected by L363 through flow cytometry. The data represent means ± SEM (n = 8, two independent experiments), *P < 0.05, **P < 0.01, ***P < 0.001, (b,e) One-way ANOVA, (f) Mann-Whitney U test.

