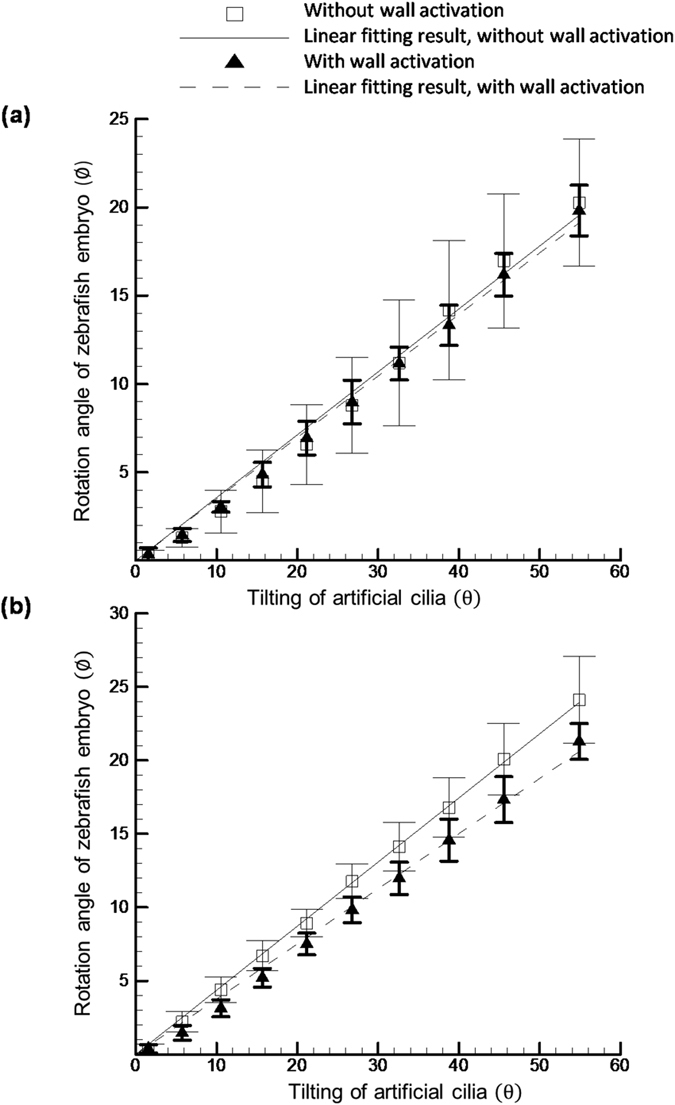
Figure 7.

Quantification of the relative rotation of 5 d.p.f. (a) and 6 d.p.f. (b) zebrafish corresponding to the artificial cilia tilting with and without wall activation. The solid and dotted line represents the linear fitting results of the measured curves.
