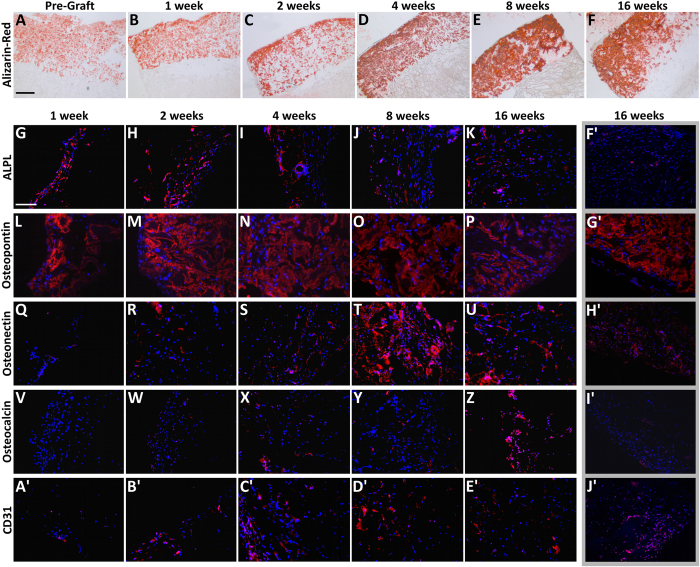
Figure 4. Alizarin Red S and immunofluorescence staining.
(A–F) Alizarin Red S staining showing the time-course of increasing calcium mineralization within the implanted scaffolds. It is evident that the calcium deposits are mainly localized in the bony layer. (G–E′) Panel of fluorescence microscope images showing the time-course of expression of crucial osteogenic and angiogenic markers by the host cells populating the Coll-MHA layer of the scaffolds. (F′–J′) Examples of fluorescence microscope images showing the expression of osteogenic and angiongenic markers in the Coll layer: ALPL and osteocalcin have shown a low signal at all time-points (examples in F′,I′), whereas an increased expression of osteopontin (B′) and a little increase of osteonectin (H′) and CD31 (J′) could be observed at week 16. Scale bars: 500 μm in A for (A–F); 100 μm in (G) for all fluorescence images.

