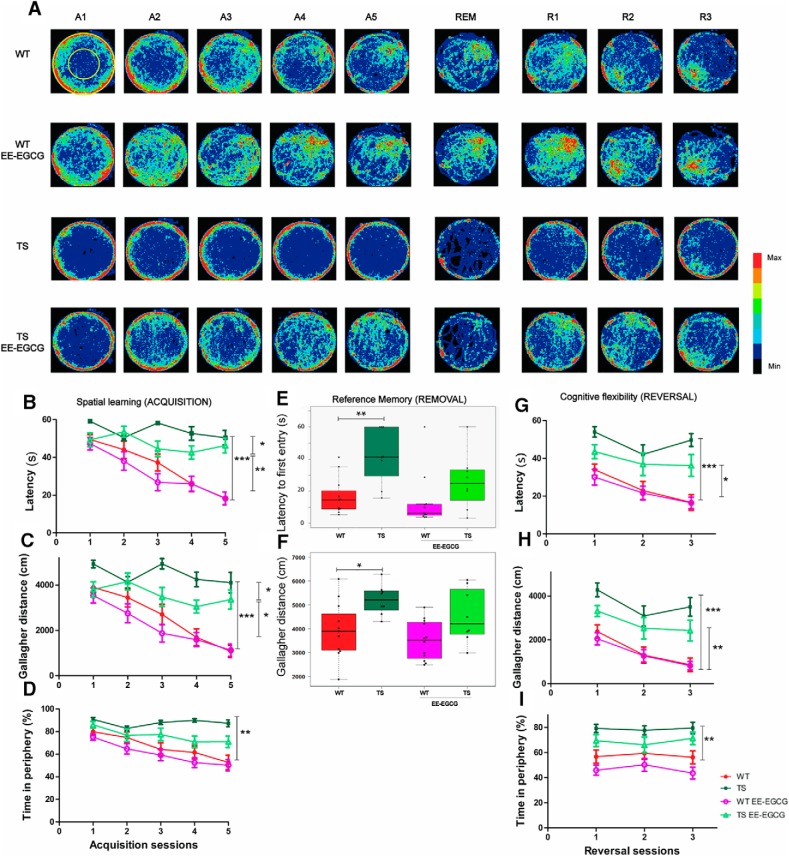
Figure 1.
EE–EGCG treatment effects on young Ts65Dn mice deficits in spatial learning, reference memory and cognitive flexibility. A, Heat map representing the accumulated swimming trajectories of mice from the different experimental groups across acquisition, removal, and reversal sessions in the MWM. Periphery and center zones are depicted at upper left. Color code is represented on the right, with red corresponding to the most visited zones and black to less visited or nonvisited zones. Learning curves are represented in latency (s) to reach the escape platform (B), Gallagher distance (accumulated distance to the goal in cm; C), and thigmotaxis (percentage of time spent on the periphery; D) during the acquisition sessions. E,F, Boxplots of the distribution of latency to the first entry to the platform area and the Gallagher distance of the four experimental groups in the removal session. Dots indicate the values of each individual mouse. Reversal learning curves are represented in latency (s; G), Gallagher distance (H), and thigmotaxis (I). A1-5, acquisition sessions 1–5; R1-3, reversal sessions 1–3 with four trials per day; REM, removal session. Data in B, C, D, F, G, and H are mean ± SEM. Data in B and F were analyzed by a censored model, which considered 60 s as the maximum trial duration. Data in C, D, G, and H were analyzed with ANOVA repeated measures, and data in E were analyzed by one-way ANOVA. In all cases, Tukey multiple post hoc comparisons corrected with Benjamini–Hochberg were used. Even if all groups were considered for multiple comparisons, the figure reports only statistically significant differences of the following relevant contrasts of interest: WT versus TS; TS versus TS EE-EGCG; WT versus TS EE-EGCG. *p < 0.05, **p < 0.01, ***p < 0.001.

