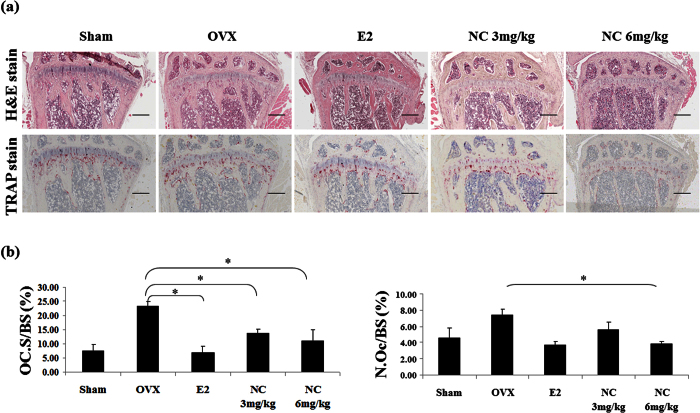
Figure 6. Histological analysis of trabecular bone with H&E and TRAP staining in proximal tibia.
(a) representative images of H&E and TRAP staining (×40 magnification). (b) Oc.S/BS, osteoclast surface per bone surface; N.Oc/BS, number of osteoclasts per bone perimeter. Values are means ± SE from 6 mice per group. *p < 0.05 compared with the sham group.

