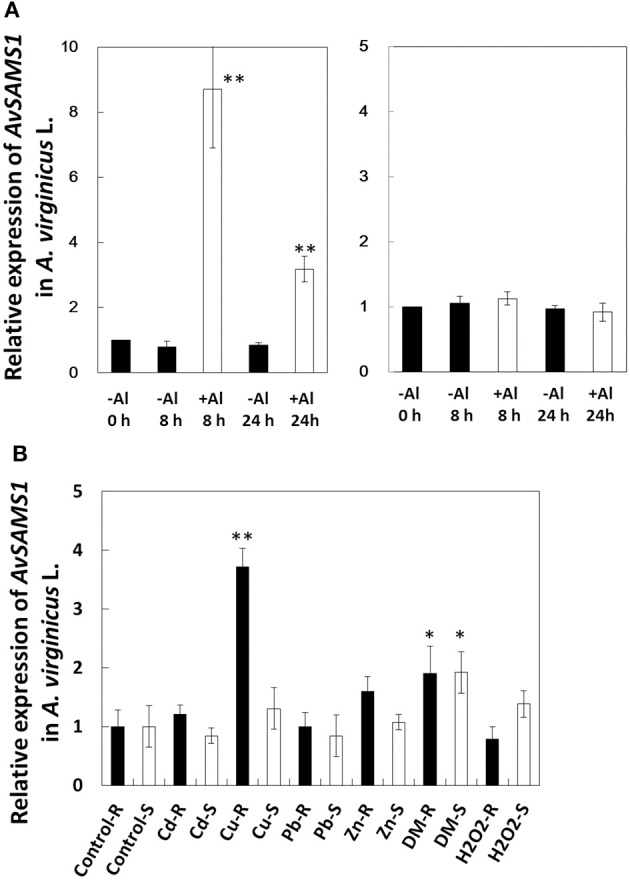
Figure 2.

Gene-expression profile of AvSAMS1 in A. virginicus L. (A) Al. Gene expression in root (left) and shoot (right) are represented as expression of the AvSAMS1 relative to each control condition (-Al, 0 h). (B) Cd, Cu, Pb, Zn, DM, and H2O2. Gene-expression under each tested condition in roots (R) and shoots (S) are also shown as relative expression to the control conditions (Control-R and Control-S, respectively). Error bars indicate standard deviations (SD). Asterisks indicate significant differences to each control (*p < 0.05, **p < 0.01).
