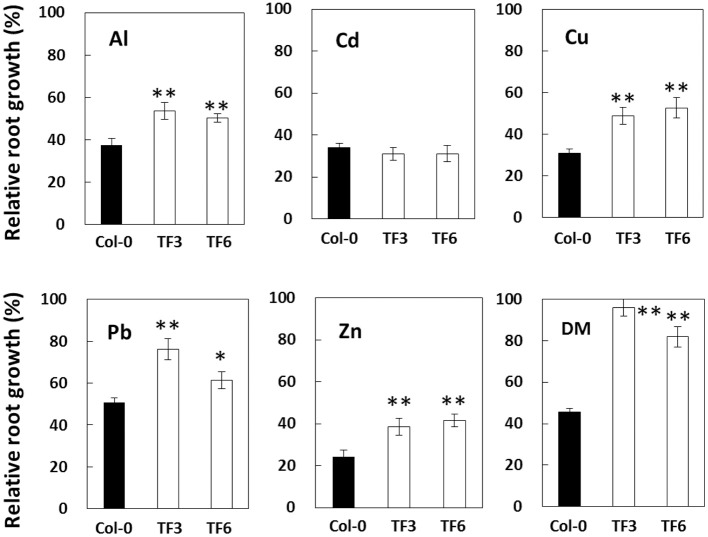
Figure 3.
Results of stress sensitivity tests in A. thaliana TF. Two of the constructed A. thaliana TF expressing the AvSAMS1 gene (TF3 and TF6) and their parental non-TF line, Col-0, were treated with various stressors and then measured for root length. Results were shown as relative root growth (%) as described previously (Ezaki et al., 2000). Error bars indicate SD. Asterisks indicate significant differences to each control shown as black bar (*p < 0.05, **p < 0.01).

