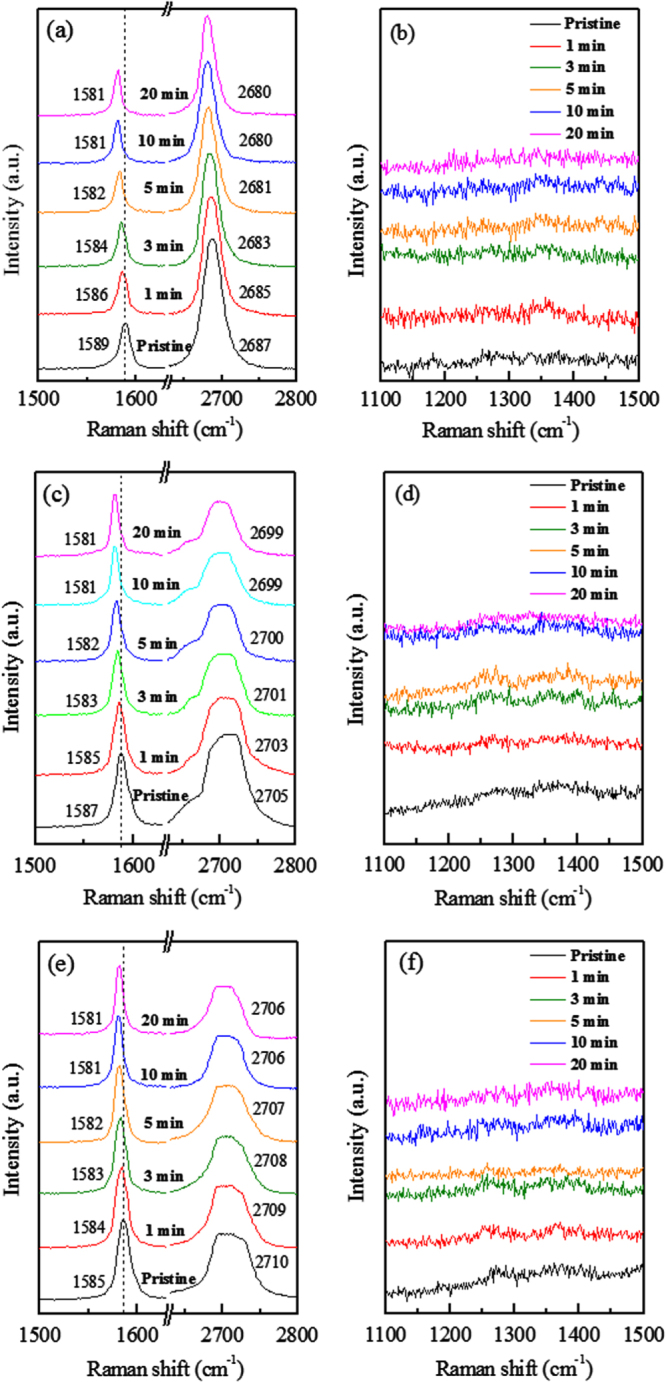
Figure 2.

Raman spectra of (a) pristine and KNO3-doped SLG, (c) pristine and KNO3-doped BLG and (e) Pristine and KNO3-doped TLG. (b), (d) and (f) depict the absence of D peak of pristine and KNO3-doped SLG, BLG and TLG, respectively. The colors coding of panels a, c and e are same as panel b, d and f, respectively.
