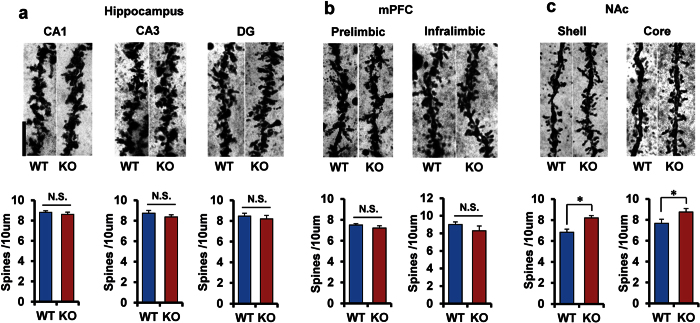
Figure 3. Increased spine density in the NAc of α7 nAChR KO mice.
(a) CA1, CA3, DG from hippocampus. (b) Prelimbic and infralimbic regions of medial prefrontal cortex (mPFC). (c) Sell and core regions of NAc. Data represent the mean ± S.E.M. (n = 5). *P < 0.05 compared with the WT group (Student t-test).

