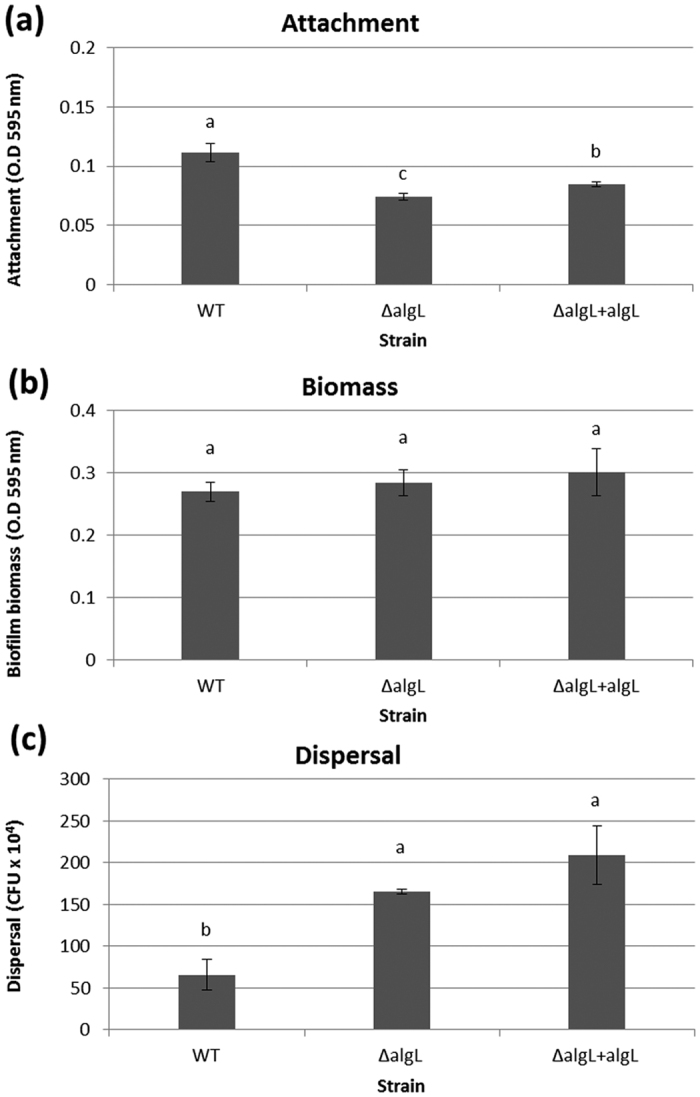
Figure 5. Effect of AlgL on cell attachment, biofilm biomass and dispersal.

Attachment efficiencies, biofilm biomasses and dispersal efficiencies were analyzed in a microtiter plate assay. (a) Mean attachment efficiencies ± SE (n = 8) at 2 h, as determined by crystal violet staining. Attachment efficiencies are expressed as absorbances at 595 nm. (b) Mean biomass of biofilms ± SE (n = 4) at 72 h, as determined by crystal violet staining. (c) Mean dispersal efficiencies ± SE (n = 4) at 72 h expressed as colony forming units (CFU × 104). In panels (a–c) different letters displayed above columns indicate statistically significant differences (p < 0.05) in attachment efficiency, biofilm biomass and dispersal efficiency, respectively. Attachment efficiencies (a) were not normally distributed (Shapiro-Wilk test: P < 0.05) and thus were analyzed using non-parametrical ANOVA followed by Bonferroni (Dunn) t tests for multiple comparison between treatments. Biofilm biomasses (b) and dispersal efficiencies (c) were normally distributed (Shapiro-Wilk test: P > 0.05), and thus analyzed using ANOVA with multiple LSD test for multiple comparison between treatments. In panels (a–c), strains are identified as follows: WT = PDO300(pHERD20T), ΔalgL = PDO300ΔalgL(pHERD20T), and ΔalgL + algL = PDO300ΔalgL(pHERD20T:algL).
