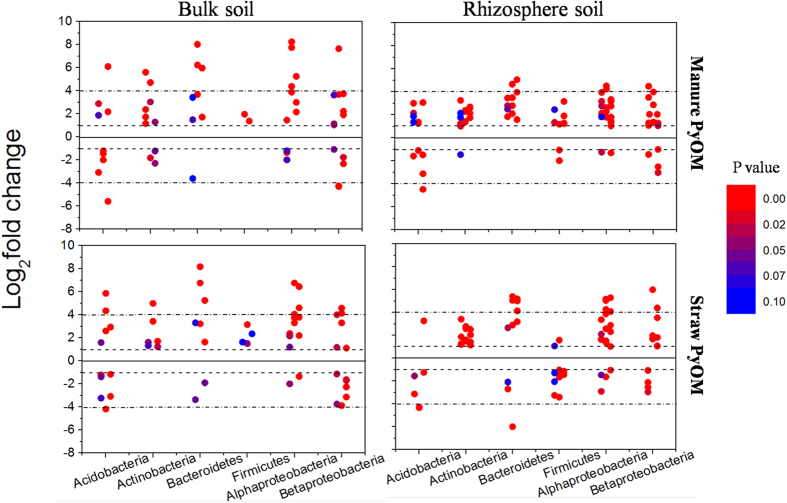
Figure 3. Bacterial responding genera (defined as log2-fold change >1, adjusted p values < 0.1) in each taxonomy as compared with PyOM unamended soils in bulk and rhizosphere soils.
Each circle represents a single bacterial genus. Dash line and dash dot line represent increases/decreases of 2x and 16x, respectively. Responders with log2-fold change <1 or adjusted p values > 0.1 were not presented.

