Figure 7.

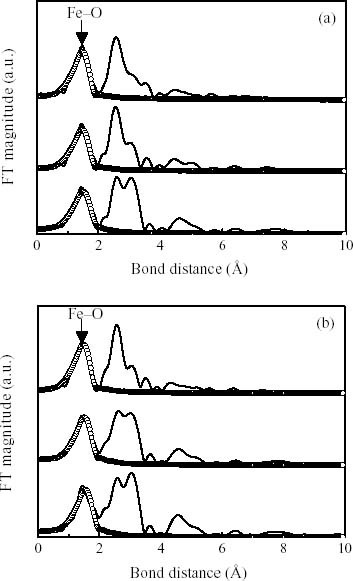
Fourier transform of Fe K-edge EXAFS for the reduction of (a) NO2- and (b) NO3- solutions with the initial concentrations of 150, 200, and 250 mg l-1, respectively. The best fitting of the EXAFS spectra are expressed with the circle lines.

Fourier transform of Fe K-edge EXAFS for the reduction of (a) NO2- and (b) NO3- solutions with the initial concentrations of 150, 200, and 250 mg l-1, respectively. The best fitting of the EXAFS spectra are expressed with the circle lines.