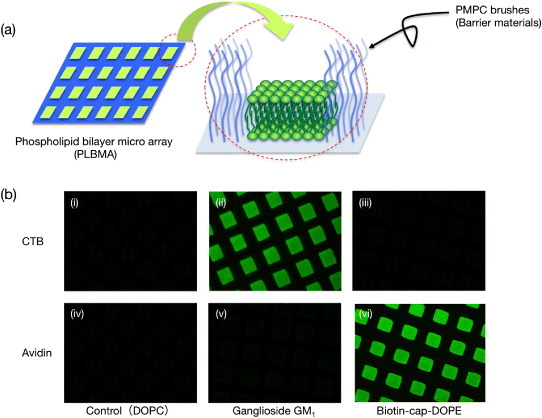
Figure 10.

(a) Schematic of phospholipid bilayer microarray (PLBMA) decorated by well-defined poly(MPC) brushes. (b) Fluorescence micrographs of PLBMA containing: (i, iv) DOPC; (ii, v) 2.0 mol% GM1 in DOPC; (iii, vi) 2.0 mol% biotin-cap-DOPE in DOPC. The top row shows contact with each PLBMA and the Alexa 488-labeled 50 nM CTB (i, ii, iii); the bottom row shows contact with the Alexa 488-labeled 50 nM NeutrAvidin (iv, v, vi) in human plasma.
