Figure 3.

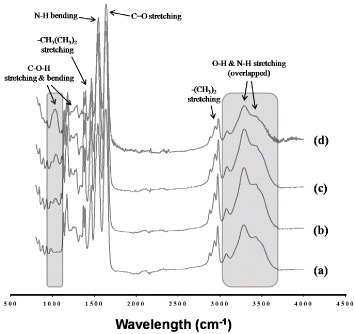
ATR-FTIR spectra of PNIPAAm (a), PNH_3 (b), PNH_5 (c) and PNH_10 (d) NFs before crosslinking. The shaded areas around 1050 and 3300 cm−1 are assigned to the stretching of C–O–H and –OH groups in HMAAm, respectively.

ATR-FTIR spectra of PNIPAAm (a), PNH_3 (b), PNH_5 (c) and PNH_10 (d) NFs before crosslinking. The shaded areas around 1050 and 3300 cm−1 are assigned to the stretching of C–O–H and –OH groups in HMAAm, respectively.