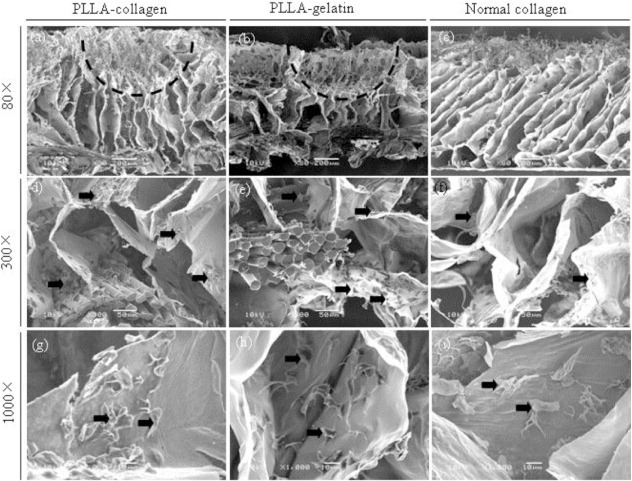
Figure 3.

SEM images of fibroblast adhesion in the PLLA–collagen hybrid scaffold (a, d, g), PLLA–gelatin hybrid scaffold (b, e, h) and control collagen sponge (c, f, i) 1 hour after cell seeding. The vertical cross sections of scaffolds were used for the SEM observation. Arrows indicate adhered fibroblasts. Dashed lines indicate a large surface pore. Scale bars: 200 μm (a–c), 50 μm (d–f), and 10 μm (g–i).
