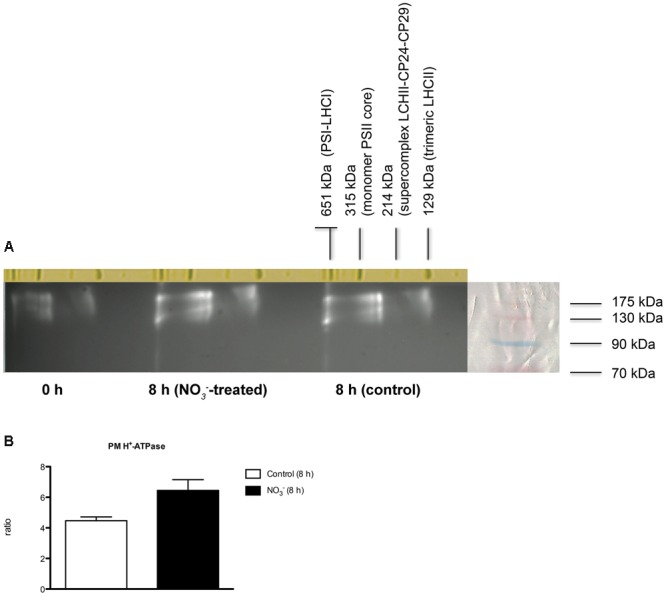
FIGURE 7.

Separation of PM H+-ATPase complexes by non-denaturing Deriphat-PAGE followed by SDS-PAGE. (A) Western blot analysis performed using antibodies anti-PM H+-ATPase. The molecular weight of each protein marker (ECL Plex Fluorescent Rainbow Markers) was reported on the right side. (B) Densitometric analysis of PM H+-ATPase. Data are expressed as ratio of corresponding 0 h sample considering the sum of all three forms (signals were quantified using PDQuestTM 2-D Analysis Software, Bio-Rad). Data are the means ± SE, n = 3.
