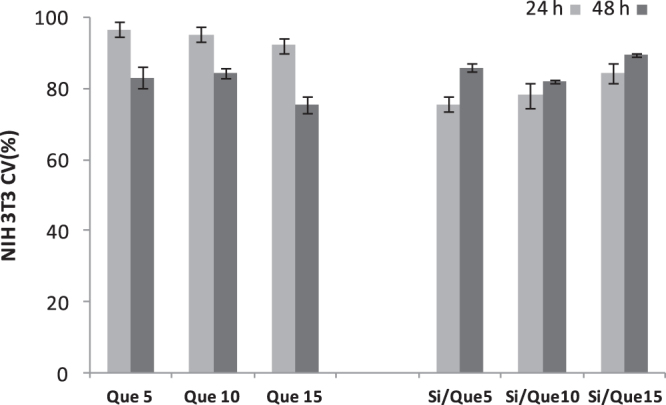
Figure 9.

Cell viability (CV, %) toward NIH-3T3 cells of Si/Que5, Si/Que10, and Si/Que15, and silica-free quercetin samples (Que5, Que10, and Que15) at 24 h and 48 h exposure times by means of MTT test results. Values, reported as percentage versus an untreated control, are the mean ±SD of measurements carried out on three samples (n = 3) analyzed 12 times.
