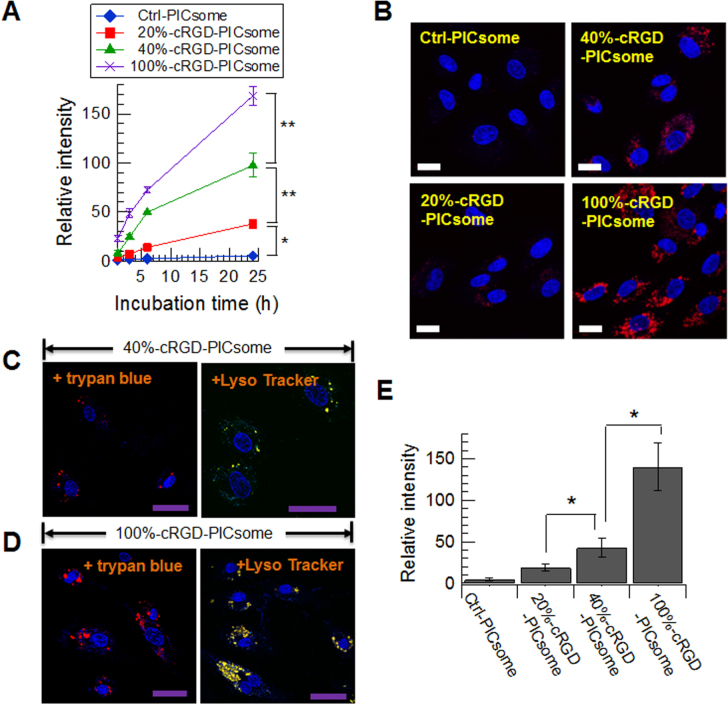
Figure 3.
Uptake of cRGD-PICsomes and Ctrl-PICsomes into HUVECs. (A) High-throughput automated analysis of fluorescence images using an IN Cell Analyzer 1000. Data are presented as the mean ± standard error of the mean (s.e.m.), n = 3. Two-way ANOVA was used to analyze the differences in the fluorescence intensity, and ∗P < 0.005 and ∗∗P < 0.001 were considered significant. (B) Images were captured after a 24 h incubation of HUVECs with PICsomes (red) using confocal laser scanning microscopy (CLSM); nuclei were stained using Hoechst 33342 (blue). Scale bar (white) = 20 μm. CLMS images of 40%-cRGD-PICsomes (C) and 100%-cRGD-PICsomes (D); the late-endosomes and lysosomes were stained using Lyso Tracker Green (green). Scale bar (purple) = 50 μm. (E) Quantitative analysis of fluorescence intensity with quenching method using trypan blue. Data are presented as the mean ± standard deviation, n = 30. The data were analyzed using Student’s t-test, and P∗ < 0.001 was considered significant.

