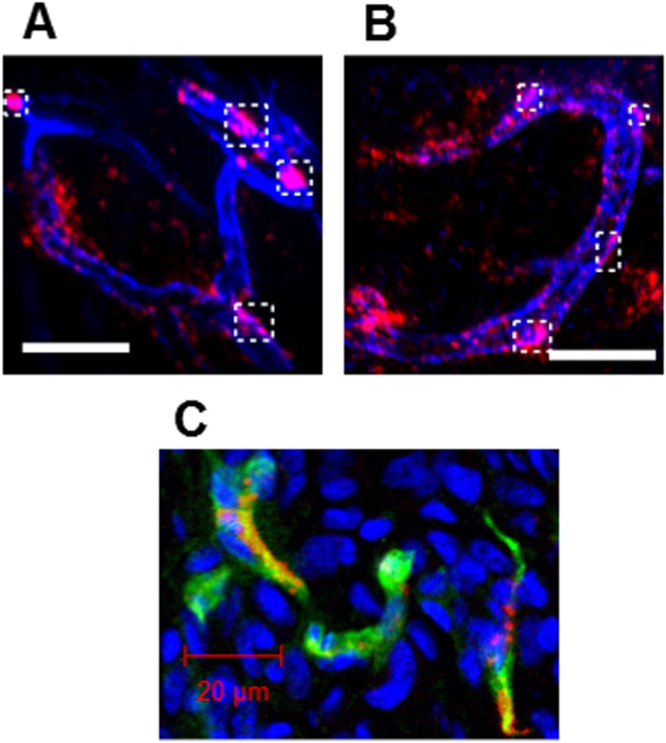
Figure 7.

IVCLSM analysis of PICsomes in the tumor vasculature. Blood vessels were pre-stained (blue) with anti-CD31 (PECAM-1) antibodies, and tumor vasculature snapshots were then taken (A) 6 h and (B) 24 h after the administration of 40%-cRGD-PICsomes (red). Scale bar = 100 μm in all images. Co-localizations of blood vessels (blue) and 40%-cRGD-PICsomes (red) in the region selected (indicated by a white rectangle in figures 7(A) and (B)). (C) Confocal laser scanning microscopy (CLMS) analysis of a tumor section. The tumor was harvested 3 h after injection of 40%-cRGD-PICsomes (red). The vasculature was stained with PECAM-1 (green), and nuclei were stained using Hoechst 33342 (blue). Scale bar = 20 μm.
