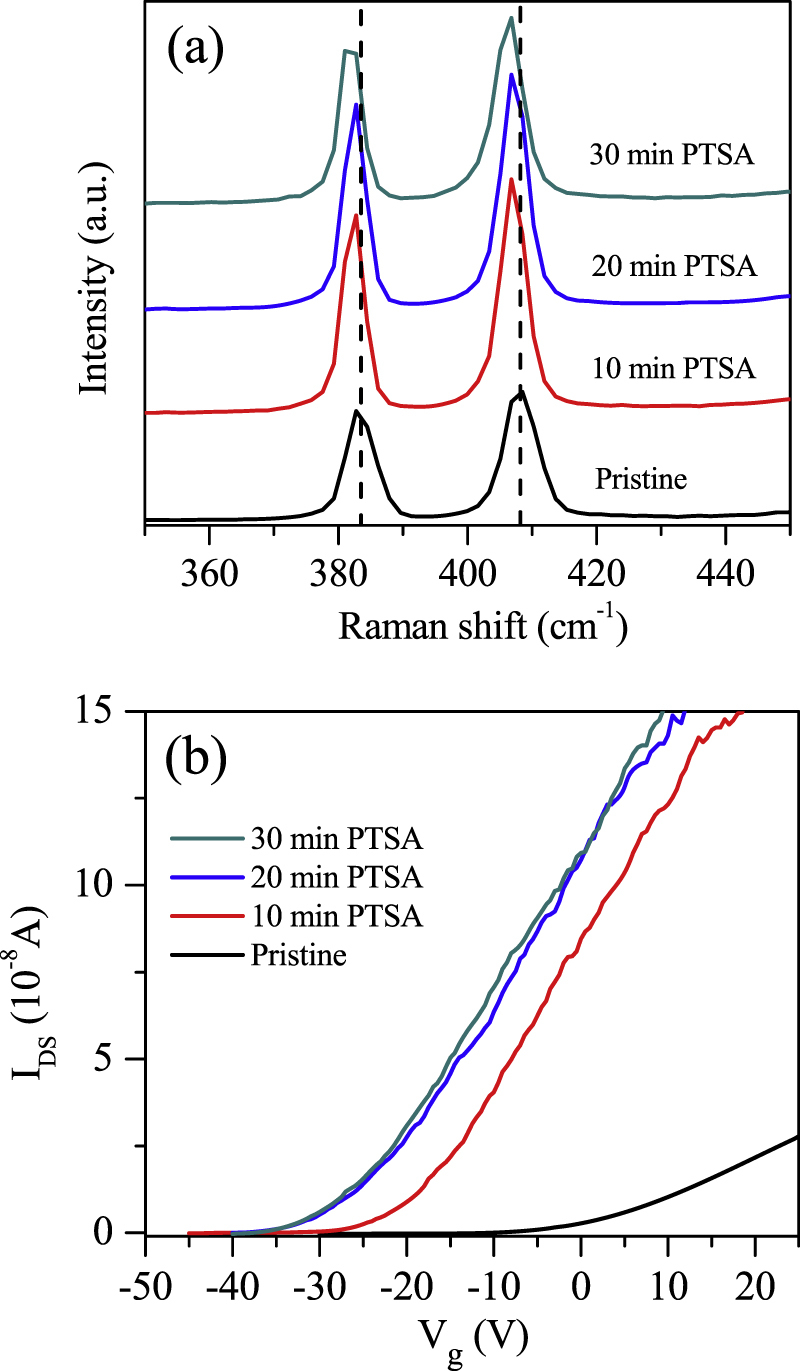
Figure 2.

(a) The Raman spectra of ML MoS2 with 514 nm laser source at room temperature before and after PTSA treatment for different exposure times. (b) Drain–source current as a function of back gate voltage (Vg) for ML MoS2 before and after PTSA treatment for different exposure times.
