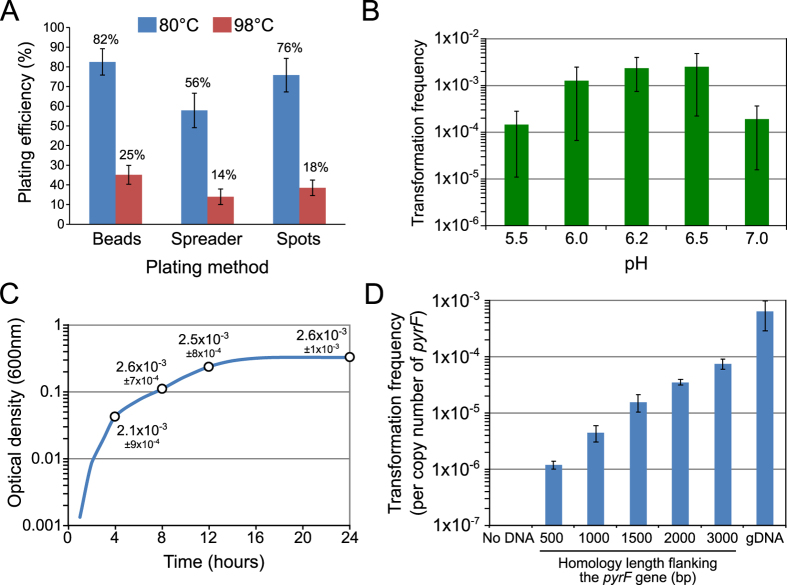
Figure 1. Growth and transformation conditions of P. furiosus COM1.
(A) Plating efficiencies using glass beads, plastic spreader and spotting at two temperatures of incubation (80 °C and 98 °C). Error bars indicate standart deviation from the mean of three independent experiments. (B) Transformation frequencies as a function of pH using flanking regions of 1500 bp. Transformation reactions contained 2 μg DNA per 1 ml of culture. 100 μl or 200 μl of cell culture (108 cells/ml) were respectively mixed with 200 ng or 400 ng of DNA. The transformation frequencies are calculated as the ratio of CFUs on selective medium (without uracil) divided by CFUs on non-selective medium (with uracil) per μg of DNA. Error bars represent standard deviation from the mean of eight independent experiments. (C) Transformation frequencies as a function of growth phase. Growth was monitored every two hours for 24 hours. Cells collected from a culture at time corresponding to exponential growth (4 h), mid-log (8 h), post-exponential (12 h) and stationary phase (24 h) were used for transformation in the same conditions as in panel B. Errors represent standard deviation from the mean of three technical replicates. (D) Transformation frequencies as a function of the size of the homologous flanking regions. Frequencies have been normalised to the copy number of the pyrF gene. Error bars indicate standart deviation from the mean of five independent experiments.

