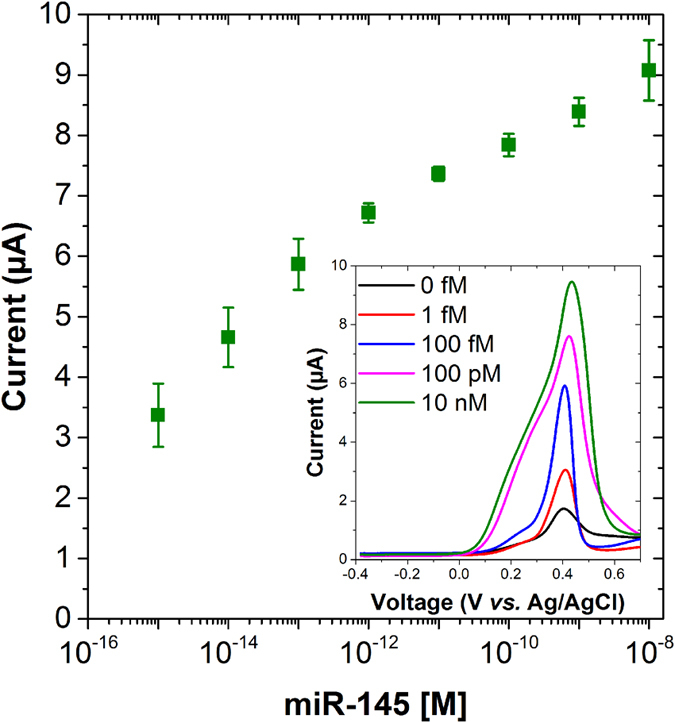
Figure 5. Dose response.

Data points represent average ferrocene peaks recorded using square wave voltammetry (SWV) from three independent samples on the binding of thiolated ferrocene with AuNPs at different concentration of mir145 (left). Inset shows the SWV curves recorded at different miR-145 concentrations.
