Figure 4.
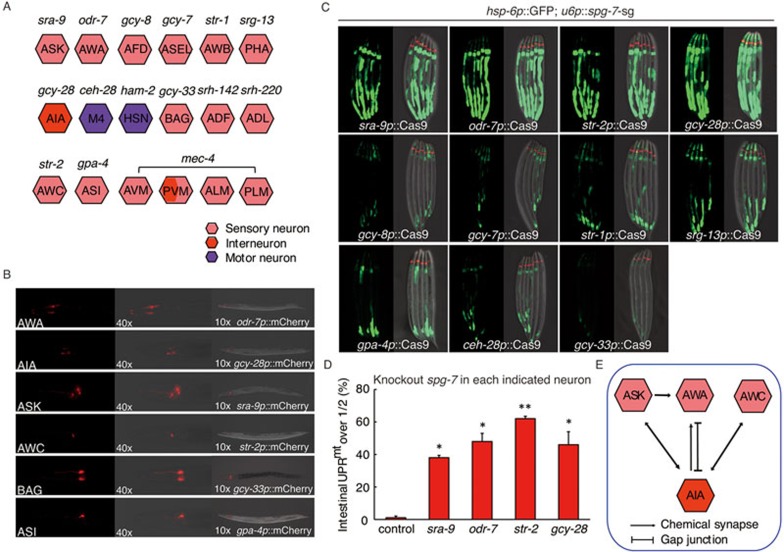
A neural sub-circuit is required for sensing and transducing mitochondrial stress. (A) A schematic graph depicting each tested neuron and its promoter. (B) Representative fluorescent images showing the expression pattern of each indicated neuronal-specific promoter. (C-D) Representative fluorescent images (C) or quantification (D) of hsp-6p::GFP reporter expression in animals containing Cas9-spg-7-sg in each indicated neuron. Analysis is performed as described in Materials and Methods. n ≥ 30, error bars indicate mean ± SE. A Student's t-test is used to assess significance: *P < 0.05, **P < 0.01. (E) A schematic graph of chemical synapses or gap junctions between ASK, AWA, AWC sensory neurons and AIA interneuron.

