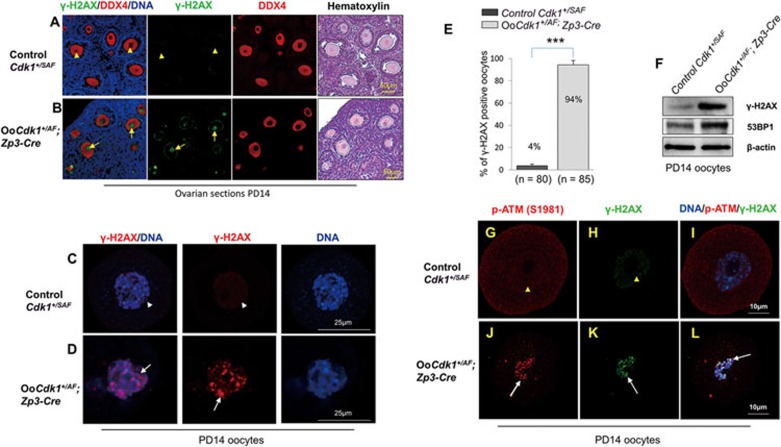
Figure 4.
Expression of Cdk1AF leads to DNA damage and ATM activation in growing OoCdk1+/AF; Zp3-Cre oocytes. (A) Absence of γ-H2AX staining in the oocytes of control PD14 Cdk1+/SAF ovarian sections (arrowheads). (B) Prominent γ-H2AX staining in the oocytes of PD14 OoCdk1+/AF; Zp3-Cre ovaries (arrows). DDX4 was used to label the oocytes and the same sections were counterstained with hematoxylin to visualize ovarian histology. The experiments were repeated more than three times each, and representative images are shown. (C) Absence of γ-H2AX staining in isolated oocytes of control PD14 Cdk1+/SAF mice (arrowhead). (D) Strong γ-H2AX staining in isolated oocytes from PD14 OoCdk1+/AF; Zp3-Cre ovaries (arrow). (E) Quantification of γ-H2AX-positive oocytes that were isolated from PD14 Cdk1+/SAF and OoCdk1+/AF; Zp3-Cre ovaries. Numbers of each genotype of oocytes checked (n) are shown. (F) Western blot for γ-H2AX and 53BP1 levels in oocytes isolated from PD14 Cdk1+/SAF and OoCdk1+/AF; Zp3-Cre ovaries. β-actin was used as the loading control. Lysate from 200 oocytes was loaded in each lane. The experiments were repeated more than three times. (G-L) High level of p-ATM (S1981) accompanied by increased γ-H2AX staining in PD14 OoCdk1+/AF; Zp3-Cre oocytes (J-L, arrows), in comparison with PD14 control Cdk1+/SAF oocytes where there was almost no signal for p-ATM (S1981) or γ-H2AX (G-I, arrowheads). The experiments were repeated more than three times each, and representative images are shown.

