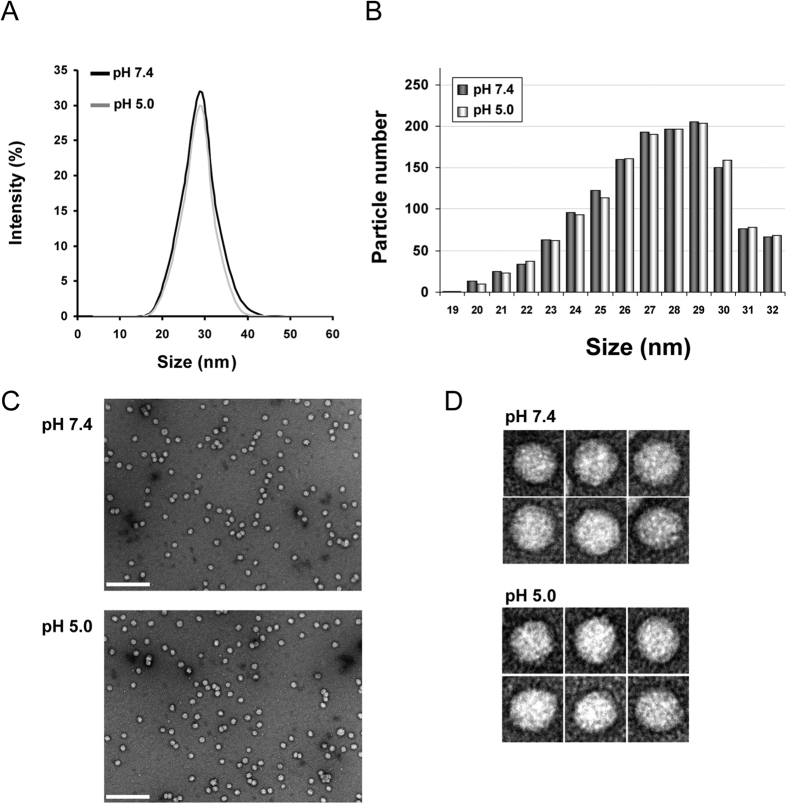
Figure 1. LDL size distribution and morphology at pH 7.4 and 5.0.
(A) Size distribution of LDL at pH 7.4 and 5.0 determined by DLS; (B) Frequency histograms showing particle size distribution of LDL at pH 7.4 and pH 5.0. (C) electron-micrographs of LDL at pH 7.4 and 5.0 at low resolution showing a homogeneous particle population; (C) selected individual LDL particles at higher magnification. Particle size was determined as described in Materials and Methods. LDL size distribution in (D) was measured as Feret diameter calculated from 1600 particles.

