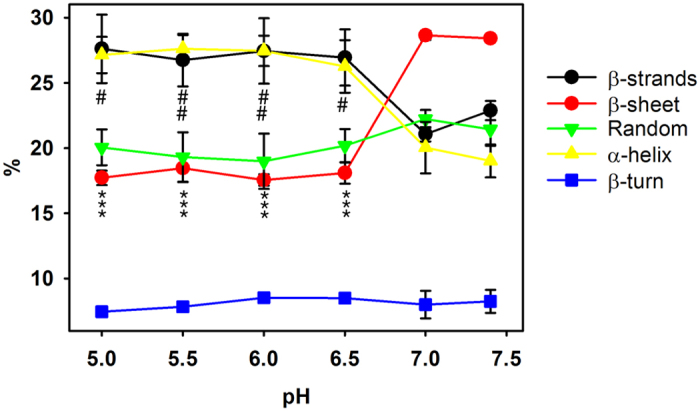
Figure 5. Percentage values of apoB100 secondary structure content at pH intervals (7.4 → 5.0).

The spectra were obtained in D2O buffer at 37 °C and data processed as described in Materials and Methods. Data are mean ± S.D. (n = 3). All measurements were performed independently 3 times and levels of significance were determined by a two-tailed Student’s t-test. ***P < 0.001 when compared β -sheet percentage content at different pH with data obtained at pH 7.4. #P < 0.05; ##P < 0.01 when compared α -helix percentage content at different pH with data obtained at pH 7.4.
