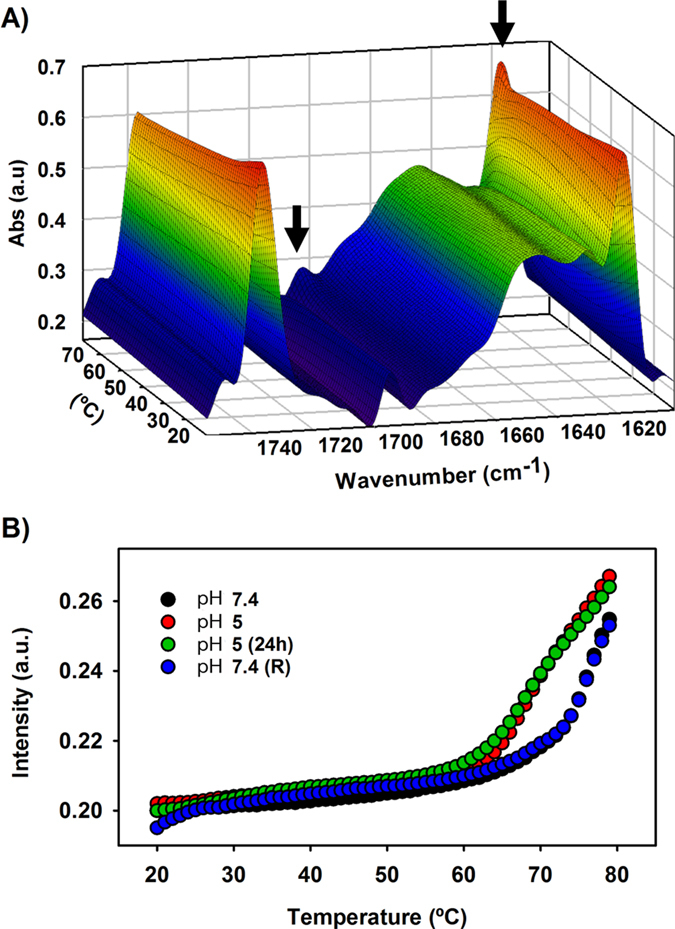
Figure 6. Thermal stability of apoB100 LDL and lipid moiety.

(A) deconvoluted three-dimensional spectra of LDL at pH 7.4. LDL was heated from 20 to 80 °C at 1 °C increment per minute and the changes occurring in the protein structure were monitored by following the spectral band patterns at increasing temperatures as described in Materials and Methods. Aggregation occurring as a consequence of thermal denaturation, with bands appearing together at 1682 and 1617 cm−1 is indicated by black arrows. (B) Intensity of the 1682 cm−1 band as a function of temperature in LDL incubated at pH 7.4, pH 5.0, LDL incubated for 24 h at pH 5.0 and LDL after pH neutral restitution. The spectra were obtained in D2O buffer at 37 °C and data processed as described in Materials and Methods.
