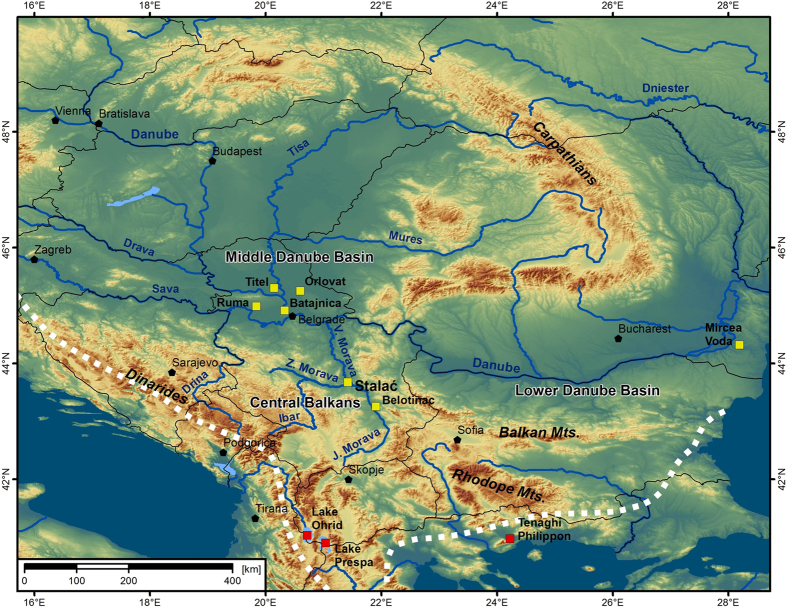
Figure 1. Map of the Balkan Peninsula, Middle and Lower Danube Basins, showing key loess-palaeosol sequences (yellow rectangles; Stalać (this study), Ruma26, Titel36, Batajnica5,6,25, Orlovat10,37, Belotinac15,16, Mircea Voda5,6,25) and lacustrine records (red rectangles; Ohrid34, Prespa35 and Tenaghi Philippon31) discussed in this paper.
The white dashed line represents the current northern limit of the Mediterranean climate. The map was generated using ArcGIS 10.2.2 (http://www.esri.com/software/arcgis/arcgis-for-desktop/free-trial).

