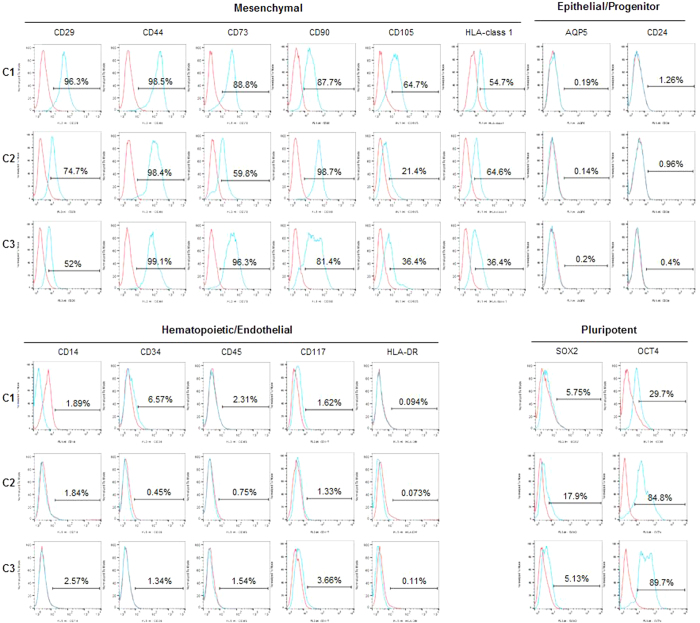
Figure 4. Analysis of multilineage cell marker expression.
Flow cytometric analysis was conducted to monitor the marker expression of clonal SG cells. Numbers above bracketed lines indicate the percentage of the cell population. Similar to MSCs, clonal SG cells commonly expressed MSC markers, but did not express hematopoietic/endothelial markers. Clonal SG cells were also positive for Oct4, but negative for Sox2. Basal expression of AQP5 was not detected and samples were negative for CD24, a recently suggested salivary progenitor marker. Blue line, each marker indicated; red line, isotype-matched control antibody.

