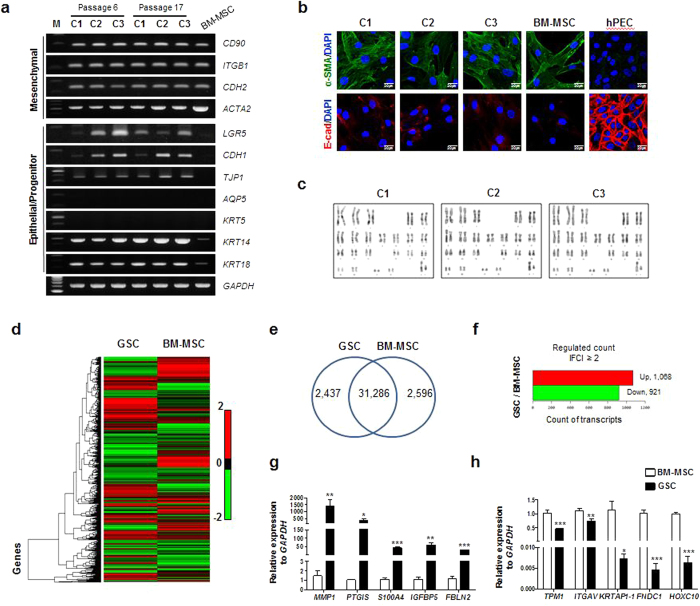
Figure 5. Screening differential gene expression.
(a) Differential basal gene expression between human clonal SG cells and human BM-MSCs was analyzed by RT-PCR. The gel images are cropped for clarity from the full-length images under the same experimental conditions. The original images are provided in Supplementary Fig. 2. (b) Epitheliomesenchymal properties of the SG clones revealed by immunofluorescence staining for a-SMA (mesenchymal) and E-cadherin (epithelial). Primary cells isolated from human parotid glands were used as epithelial controls. Scale bars represent 20 μm. (c) Karyotype analysis of clonal SG cells cultured for 17 passages. (d) NGS-mediated transcriptome analysis comparing putative GSCs and BM-MSCs. (e) Venn diagram showing total number of analyzed genes for each group (GSC, BM-MSC and merged GSC/BM-MSC). (f) Differentially expressed genes between putative GSCs and BM-MSCs with ≥2-fold increase or ≤2-fold decrease. (g,h) Confirmation of NGS results for 10 genes using real-time RT-PCR.

