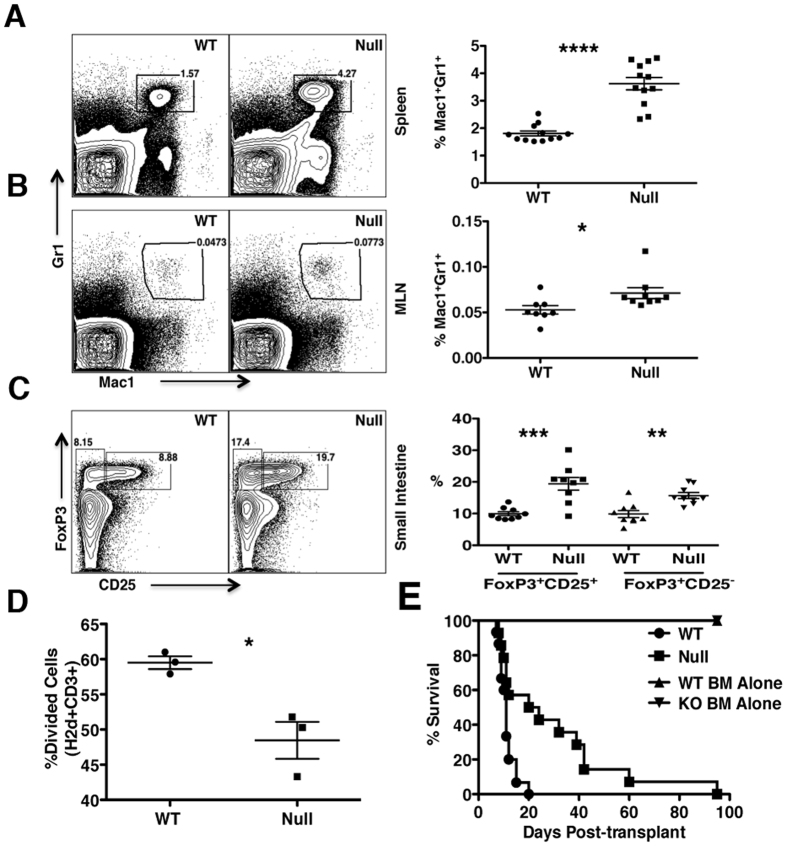
Figure 5. LRBA deficiency enhances resistance to GvHD.
(A) Representative contour plots (left) showing Mac1+ Gr1+ MDSC after gating for viable cells from splenocytes of WT and LRBA-Null mice and scatter plot (right) showing the frequency of Mac1+ Gr1+ MDSC (pooled data from 3 experiments is shown, with total N = 12, ****p < 0.0001). (B) Contour plot (left) and scatter plot (right) showing frequency of Mac1+ Gr1+ MDSC in the mesenteric lymph node (MLN) of WT and Null mice (pooled data from 3 experiments is shown, N = 8–9, *p < 0.05). (C) Flow cytometry plots (left) and scatter plot (right) indicating frequency of FoxP3+ CD25+ (nTreg) and FoxP3+ CD25− (iTreg) cells gated on live CD3+ CD4+ small intestinal lamina propria lymphocytes from WT and Null mice (pooled data from 3 experiments is shown, N = 9, ***p < 0.001, **p < 0.01). (D) Percentage of divided (CFSE diluted) BALB/c responder (CD3+H2d+) cells co-cultured with irradiated LRBA null and WT stimulators in one way MLR assay is shown. Experiment is representative of two independent experiments (*p < 0.05). (E) Lethally irradiated 129Sv WT (n = 15) and LRBA-null hosts (n = 14) received 1 × 10⁷ T-cell depleted BM cells plus 2 × 10⁶ purified splenic T-cells from BALB/c donors whereas WT and Null controls (n = 5) received T-cell depleted BM cells only. Mice were monitored for survival and data is presented as a step-function (**p < 0.01, log-rank test).

