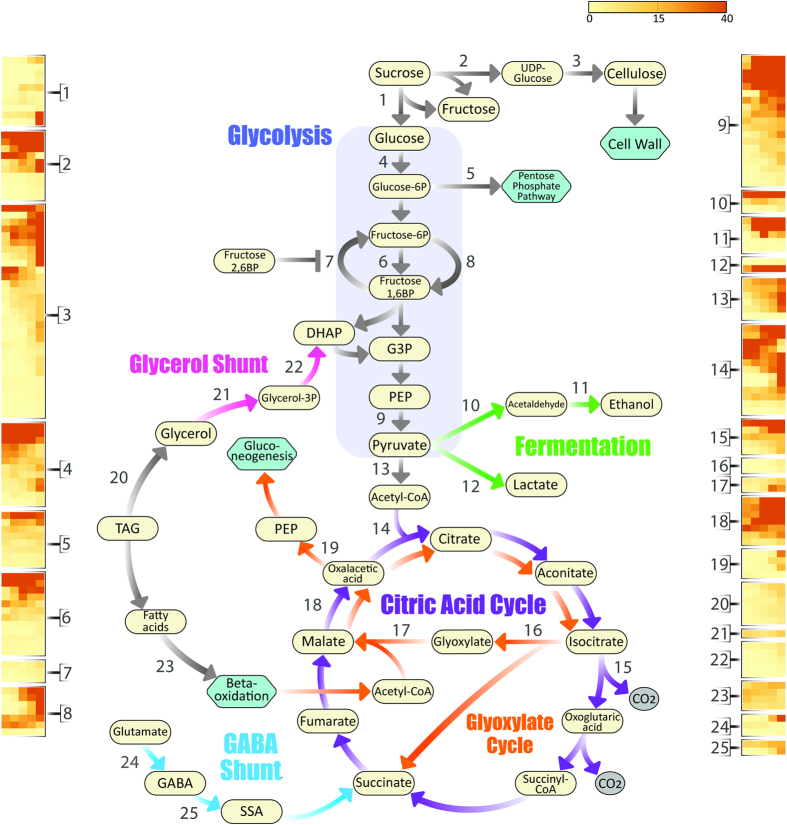
Figure 2. Major metabolic pathways and enzymes discussed in this study.
Transcriptional levels of key genes are represented in heatmaps. Genes are numbered as following: 1) invertase; 2) sucrose synthase (SuSy); 3) cellulose synthase; 4) hexokinase (HK); 5) glucose-6-phosphate dehydrogenase (G6PDH); 6) phosphofructokinase (PFK); 7) Fructose 1,6-bisphosphatase (FBPase); 8) diphosphate-fructose-6-phosphate 1-phosphotransferase (PFP); 9) pyruvate kinase (PK); 10) pyruvate decarboxylase; 11) alcohol dehydrogenase (ADH); 12) lactate dehydrogenase (LDH); 13) pyruvate dehydrogenase subunit E2 (PDH-E2); 14) citrate synthase (CSY); 15) isocitrate dehydrogenase (IDH); 16) isocitrate lyase (ICL); 17) malate synthase (MSY); 18) malate dehydrogenase (MDH); 19) phosphoenolpyruvate carboxykinase (PEPCK); 20) triacylglycerol (TAG) lipase; 21) glycerol kinase; 22) glycerol-3-phosphate dehydrogenase (GPDHC1); 23) COMATOSE (CTS); 24) glutamate decarboxylase (GAD); 25) gamma-amino-N-butyrate transaminase (GABA-T). The 5 columns in each heatmap represent the germination time points (dry; 3-HAI; 6-HAI; 12-HAI; 24-HAI). Other abbreviations: G3P: glucose-3-phosphate; DHAP: dihydroxyacetone phosphate; PEP: phosphoenolpyruvate; SSA: succinic semialdehyde.

